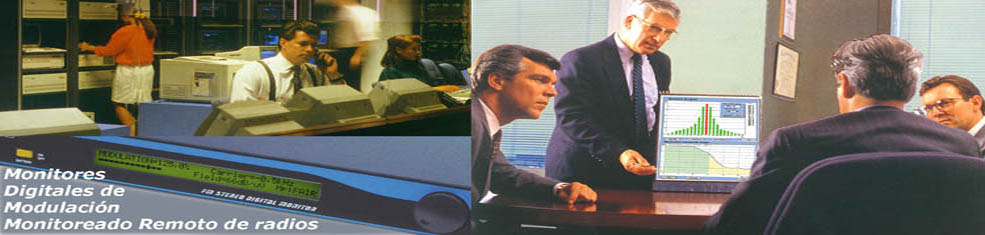
VA
16X Digital FM Monitor Analyzer
Audio and RF parameters
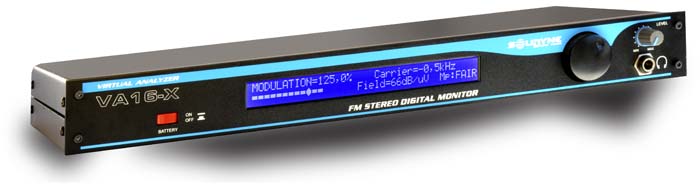
VA-16X
provides all the hardware and software
needed to monitor 18
transmission parameters.
Just connect it to the serial port,
install the software in
your computer, and you are ready to
go! Control all the measurements
and transfer the information
to your desktop for printing, storing and sharing.
Optional
internal crystal calibrator for Laboratory grade 0,1 % precision.
Never
before it was possible to have such complete information about
the behavior of an FM radio station, without going off air
to perform the measurements.
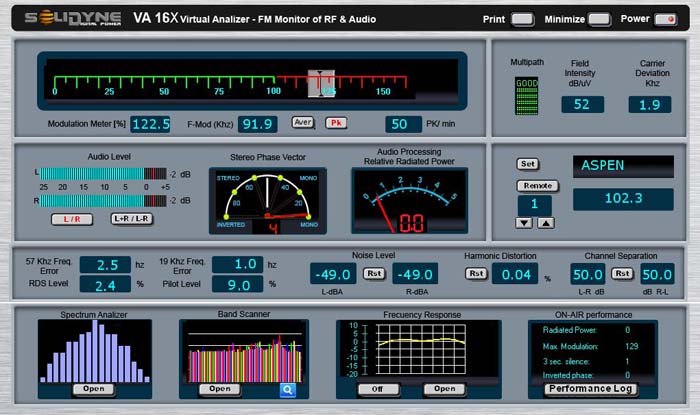
VA16
screen - View from the PC
KEY FEATURES
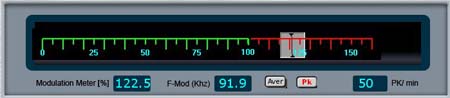
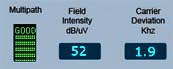
Modulation Meter in percentages, with maximum peak deviation
readout.
Selectable 4 peak integration values or instantaneous peak.
Keeps track of the number of over modulations per minute.
Optional
internal crystal calibrator with Laboratory grade
0,1 % precision
Multi path distortion indication Field Intensity Meter (VA16X
is provided with calibrated antenna)
Carrier Deviation Frequency Meter.
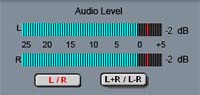
Dual precision VU meters. Selectable Left and Right channel
or L+R, L-R Digital readout of exact level
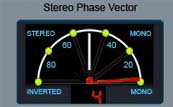
Audio Phase Vector with the built-in Inverted Phase Alarm,
detects connection errors at a glance.The Phase Vector gives
an accurate measure of the quality of the stereo sensation perceived by audience
19Khz pilot tone frequency error in 0,5 hz steps, and pilot
amplitude level. It measures too the 57 kHz RDS pilot amplitude and frequency error
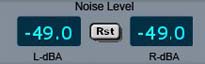
Noise Level Meter, with the ability to measure during transmission
without going off the air.
Click
here to get more info.
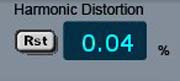
Measures Harmonic Distortion during transmission without
going off the air. Click
here to get more info.
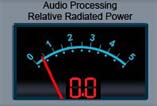
Audio Processing Relative Radiated Power Meter. Measures
in real time the energy of the audio signal. This way you
can compare objectively different audio processors presets. Click
here to get more info.
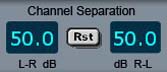
Measures Channel Separation (L to R and R to L) during transmission
without
going off the air. Click
here to get more info.
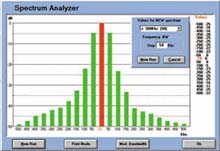
Spectrum Analyzer mode.
Click
here to get more info.
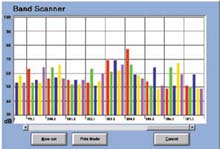
Band Scanner shows all the FM stations
with their respective
field intensities.
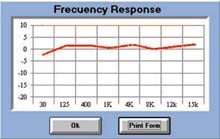
Frequency Response analysis without going off the air, using
short spots (included in the CD-ROM as WAV & CD format
audio). Carry out daily measurements in such a way that
listeners will not even notice it. Click
here to get more info.
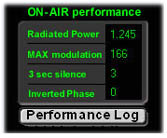
On-Air Performance Log. Keeps track of Modulation Level,
Audio Processing Relative Radiated Power, Audio Phase Vector,
over modulation peaks per minute, transmission gaps, etc.
Displayed in text and charts form. Click
here to get more info.
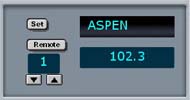
16 preset Stations, including 9 digit identification. Click
here to get more info.
Advanced Spectrum measurements
Only VA16 allows you to have this powerful tool
Band Scanner: this diagram allows you to get quickly all the radio stations at the dial and the field intensities in dB/uV You will know immediately when a radio changes its transmitter power or antenna gain. Of course, if a new radio appears at the dial, you will know it immediately. Using VA16 remote with IP option connected to Internet, you will have full information of the FM spectrum of each City, no matter how far it is.
Spectral Zoom Analyzer: You define the start and end frequencies and the VA16 makes a detailed analysis with 10 KHz wide band. Central frequencies and FM lateral bands appears showing antenna or transmitter problems
3D Spectrum Analyzer:This new diagram that only VA16 offers you, has "magic" properties... It uses advanced mathematical algorithms to show, in several colors, the "average occurrence" of each spectral frequency.
By example red indicates a high occurrence probability, yellow a very low, green is a medium occurrence. The VA16 performs the spectrum analysis hundred of times in order to calculate this statistical values. What is the utility of 3D spectrum ?
Incredible; the spectrum shows (see above) all the field levels in dB/uV below the RF level of carrier and lateral bands of the near radio stations !
Then you can evaluate the residual band noise under the RF carrier of high power FM stations without go out of air. If you are designing a new radio station at the outskirts of the city, the noise floor is very important to evaluate the power you need to have good reception at downtown.
You can evaluate too the presence and carrier level of remote stations very far from the city; it allows you to calculate at which distance this weak level will be strong enough to interfere the station
VA16X
models with LCD display
The
VA16/LCD models has a large 40 x 2 LCD display back lighted. They can work
at the same time with a PC connected or as a stand alone unit, without
PC. The LCD display can perform 12 measurements of RF and audio. The PC
is only necessary for measures that involves graphics (Freq Response,
Spectrum Analyzer, etc)
Tuning, Antenna Calibration, etc, are done by the use of a Jog Wheel
Portable model has a battery charge indicator and and adjustable timer
to turn off the display back light in order to save battery
The
portable VA16/P/LCD is the only measurement set in the world that gives you
full audio and
RF measures in a small system that you can transport while
walking !
Install
the Demo software, and take a look at this new universe of possibilities.